Baseball, among all of the major sports, is the one most closely linked to statistics. There seems to be a stat for just about every circumstance one can imagine. Each year the game becomes more and more saturated with statistics.
The use of statistics in the greatest game of all is not new. The practice of keeping records of player achievements was started in the nineteenth century by Henry Chadwick. Based on his experience with cricket, Chadwick devised the predecessors to modern day statistics, including batting average, runs scored, and runs allowed. There is even a Dodger connection to the evolution of baseball statistics. During the early 1950s, Allen Roth, a statistician for the Brooklyn Dodgers, and Branch Rickey, developed the formula for on-base percentage.
We might say the modern era of statistics took off, beginning in the sixties. In 1964, Earnshaw Cook, a John Hopkins engineering professor, published, “Percentage Baseball”, one of the first sabermetrics essays. Then in 1977, the renowned baseball historian and statistician, Bill James, wrote his first Bill James Baseball Abstract in which he featured: “18 Categories of Statistical Information That You Just Can’t Find Anywhere Else”. Moneyball followed in 2003 and Fangraphs in 2005.
So what should we, as baseball fanatics, make of all this sabermetric invasion into the game we love? What are our own personal favorite statistics by which we measure players, one to another? I really don’t understand sabermetrics and have not read nor seen “Moneyball,” however, I do have a few favorite stats that I think predate the sabermetric invasion.
On offense, I love on base percentage (OBP). It is so simple. If you got on base, then you didn’t make an out. The sole purpose of the hitter is to get to first base, hopefully beyond, but first base as a minimum. There is no other purpose to be standing at the plate. Every time the hitter gets to first base, he has the possibility of scoring a run. The greater his OBP, the greater chance he will score a run. In addition to that, being on base changes the dynamic for the pitcher. I understand that scoring a run depends on other factors on the field, but so do most, perhaps all other stat categories, so those factors are a constant with all statistics. They do not stand alone. I also appreciate batting average with runners in scoring position and two out runs batted in, but my top category is OBP. What are your favorite hitting statistics?
On the mound I prefer ERA and WHIP as a measure of a pitcher’s performance. That is perhaps old school, but I think ERA is the most important. It demonstrates how a pitcher battles during his innings, with so much happening around him, and ultimately what kind of a chance he gives his team to win the game – the lower his ERA, the better chance the game will be won while he is on the mound, or when he is replaced in the later innings by a reliever. The ERA is even more significant for the reliever, as he is pitching to very few batters, and the repercussions are greater as there is little time for his team to score more runs.
WHIP is in essence a defensive statistic determined by a combination of walks and hits per inning pitched. Once again, it is simple. The fewer runners that the pitcher allows to get on base, the fewer possible runs there are to be scored against his team. WHIP too cannot stand alone, although the walks part of the statistic is about as close to standing alone as any statistic can be, since the walk is under the pitcher’s control, or lack of it, as is the strikeout.
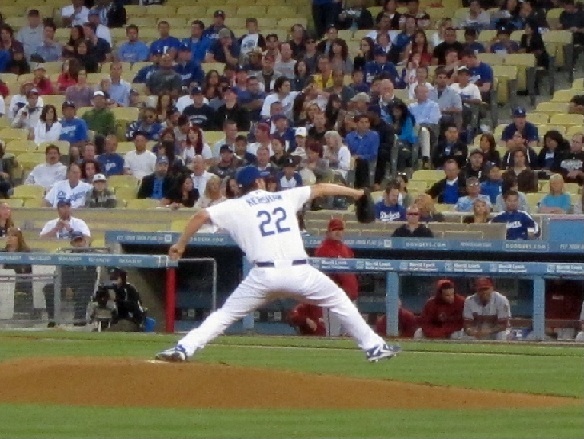
In determining Cy Young awards, wins is a huge category. However, I submit wins is not a pitching statistic, but is a team statistic, garnered by a team, combining pitching, hitting, and defense. A win is arbitrary and can have very little to do with the pitcher’s performance. That is, a pitcher can pitch a Clayton Kershaw game and lose 1-0, or pitch very poorly and win 12-11. The win or loss is not a measure of either pitcher’s performance. That performance is more accurately measured by their ERA and WHIP. If wins are to be used as a pitching statistic, then a more accurate tally of wins would be how many wins the team secured in the games a given pitcher started. That would be a measure of how many games the pitcher gave his team a chance to win, depending on his ERA and WHIP, and they succeeded in doing so. What are your favorite pitching statistics?
* * * * *
About the Author
Harold Uhlman is a life-long Dodger fan living in Nova Scotia, Canada. He is a retired school teacher and administrator whose love for the Dodgers began over a half century ago while listening to Red Barber and Vin Scully broadcast Brooklyn Dodger games over the radio. Harold’s passion for the Dodgers continued when the team moved west in 1958 and is as strong as ever today. His all-time favorite Dodger is Duke Snider. Harold is an avid baseball card collector with over 30,000 cards in his collection, many of which are current and former Dodgers and Dodger prospects. His passion within his passion is closely following the Dodger minor league affiliates and prospects.


 May 15th, 2012 at 7:15 am
  by Harold Uhlman

 Posted in

ERA for a pitcher, his job is to avoid giving up runs.
I’d say the most important statistic for a hitter is RBI. Most hitters get paid to drive in runs. Secondly the next offensive stat would be OBP.
I generally don’t pay much attention to most of the other statistics.
For hitting, it is Avg, RBIs, and OBP. When you put these three together, you get runs.
For pitching it is Wins and ERA, although ERA can be a bit misleading for relievers since they do not have a lot of IP. I understand what you are saying about wins being more of a team thing than an individual pitching thing, but wins are what get your team into the post season – period. If your starters and relievers have more wins than losses, you have an above .500 team; it’s as simple as that.
I am definitely old school and not real big into sabermetrics – for me, seeing is believing.
I guess I follow the same stats for hitting as you Harold, but I would add slugging percentage and RBI’s to the list. To me getting on is primary but to me it’s all about winning the game which translate into moving the guys on base around.
Pitching is whole issue in itself. ERA has to be the top stat to follow but Walks to Strikes is extremely important. Whip takes that into effect. I feel the win loss record doesn’t tell a fair story on a pitcher. We can all talk about pitchers who get no run support. I watch for home runs allowed i.e. the Lilly effect. Last year he was a disaster until late in the season and this year he’s leading the team in wins all due to keeping the ball in the yard. And given the roles between starters, relievers and closers the stats mean different things to different situations. At the end of the day I think with pitchers it’s subjective. When the team is winning and firing on all cylinders even a marginal pitcher can look good. But when a team can’t score runs and is down on itself even the best of pitchers can’t do everything, unless that is you Koufax and can pitch no hitters!!